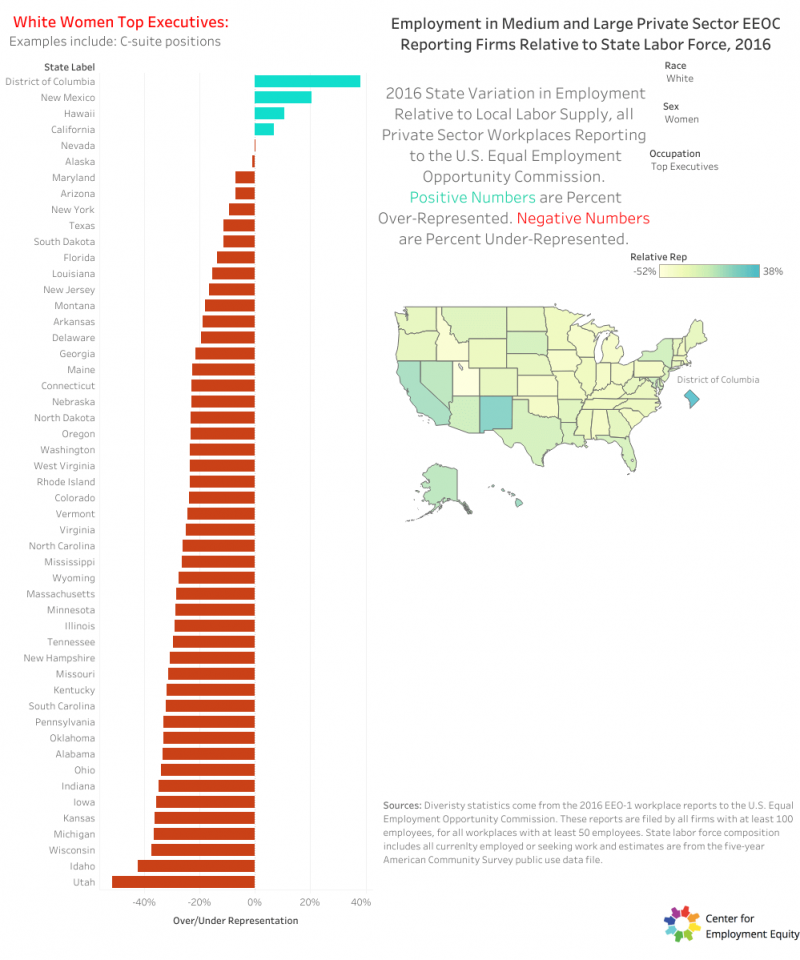
Where should you live if you are a white woman wanting to be a top executive? The answer might surprise you.
According to a new report on workplace diversity, after Washington, D.C., the state with the most white women represented in top executive positions is New Mexico.
And if you’re a white man? Well, any state will do. Though California is your best bet — white men are overrepresented in C-suite positions by 143.9 percent.
The information is courtesy of a new report on workplace discrimination by The Center for Employment Equity at the University of Massachusetts.
The data comes from the U.S. Equal Employment Opportunity Commission, a federal agency established as part of the Civil Rights Act to enforce anti-discrimination laws, process complaints, and monitor the nation’s progress towards equal opportunities in employment. To comply with regulation, the commission collects employment data from workplaces. Much of the data has not been widely available or understandable - until now.
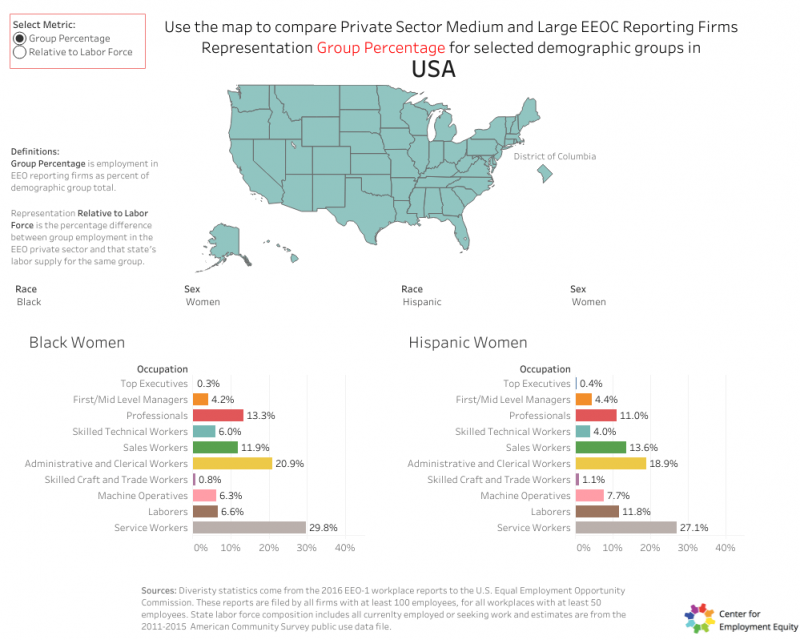
In two stunning interactive visualizations, individuals are able to examine workplace diversity state by state - controlling for factors such as race, sex, and occupation. One visualization ranks states according to representation, with red and green bars showing what percent under and overrepresented certain populations are in relationship to their presence in the labor force. The other visualization allows users to compare states - giving a clear breakdown of representation at each occupation level.
“Opportunity is a hard thing to measure, but it's not that hard to measure outcomes,” Don Tomaskovic-Devey, founding director of the Center for Employment Equity, told Sojourners. “We struggled for a while as to what is an intuitive way to think about this, and we decided that comparisons to the available labor force seemed to be the simplest way.”
What continues to surprise Tamaskovic-Devey is not just who has the most opportunity but where they have the most opportunity.
“Most of our conversations about equality or inequality use national numbers and stress the disadvantages of women and minorities, which are substantial in most states,” Tamaskovic-Devey said. “However there seem to be places where that's not the case.”
In Nevada, the proportion of white women who are executives is just about the same proportion as white women are in the labor market. And in some places like Washington, D.C. and New Mexico, white women have a higher probability of being in C-suite positions.
However, the visualizations also serve as a stunning reminder of just how underrepresented minorities are in the highest positions of power.
Unlike with white women, there is no state where black women have access to executive jobs at the same rate that they are in the labor market. The data reveals that less than 1 percent of black women and Hispanic women are top executives. At the national level, over 25 percent of black women and Hispanic women are service workers - performing jobs such as dishwashers, janitors, and travel guides.
It’s here where the data becomes a tool for action. Tomaskovic-Devey wants to ensure the data is not only seen, but questioned and included as part of the ongoing national conversation around workplace equity.
“I’m hoping that citizens, journalists, labor unions, diversity managers, and firms will look at data like this and ask the question, ‘How well is my firm doing or how well is your firm doing?” Tomaskovic-Devey said. “From a social justice perspective, there are organizations and movements in every state. In some ways, it gives them some ability to ask the questions about what the bigger problems are.”
The visualizations are available at the Center for Employment Equity. Compare workplace diversity by state here or rank by state here.

Christina Colón, a former Sojourners associate editor, is a teaching assistant at Boston University.
Got something to say about what you're reading? We value your feedback!